|
|
COMMENTS
|
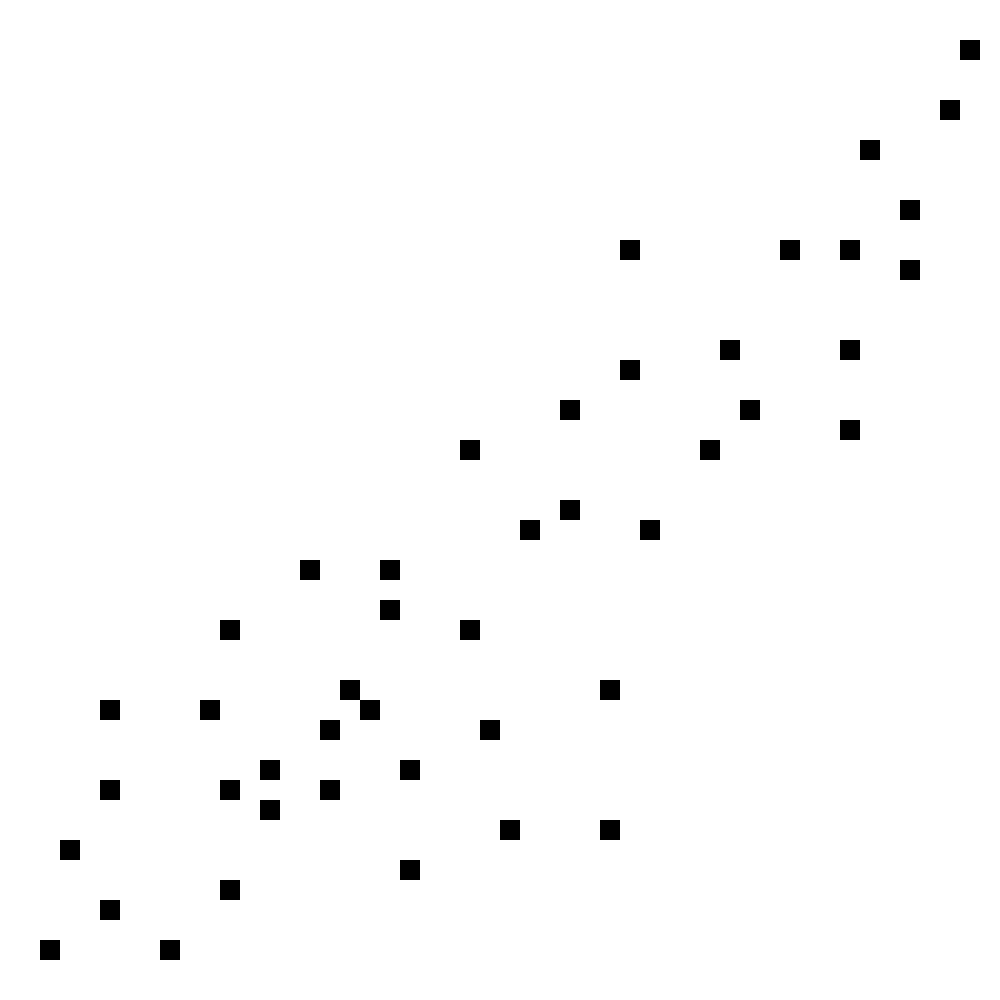
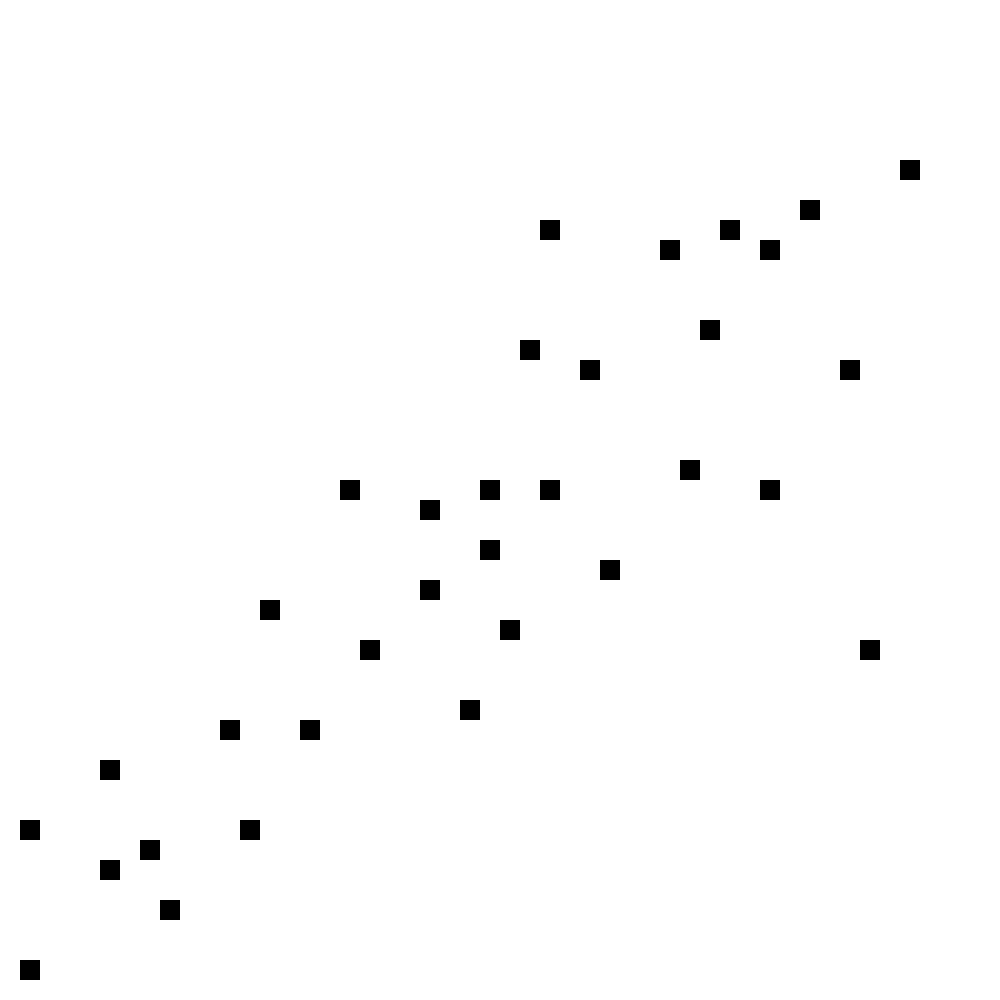
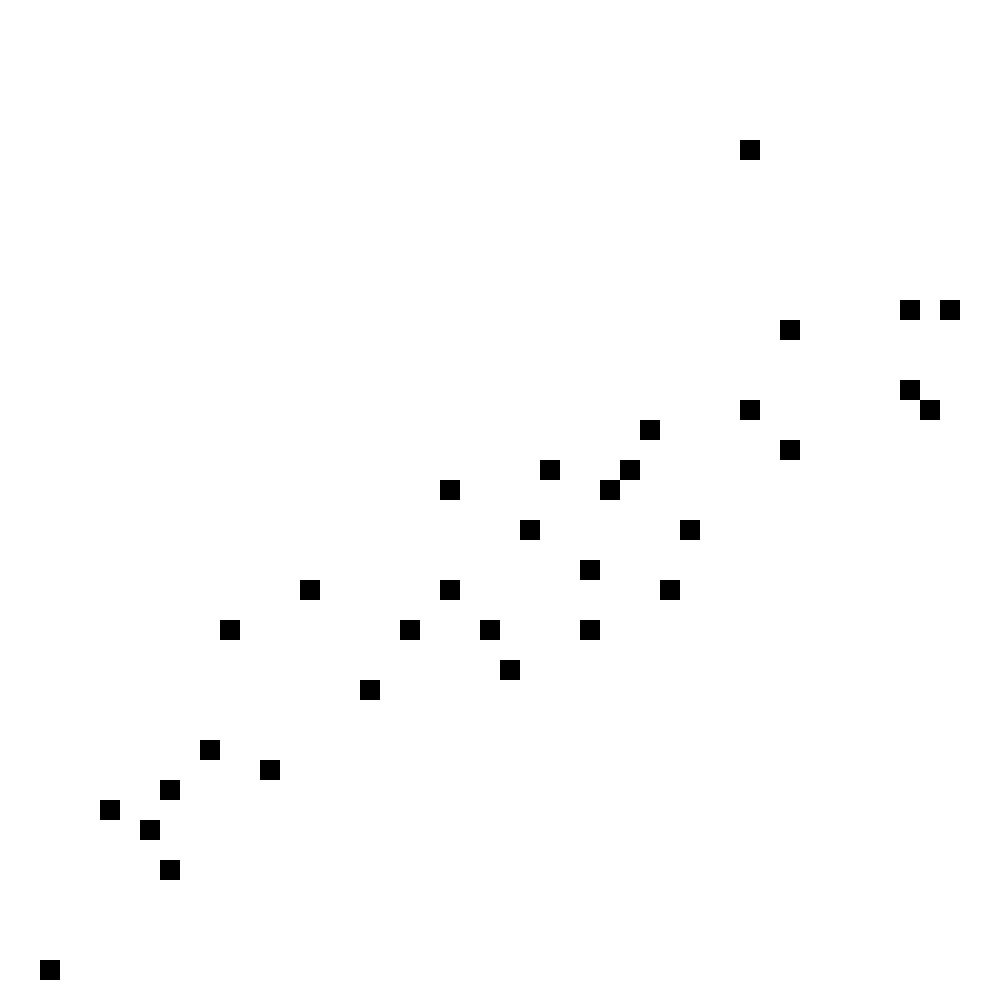
All examples in this Bongard Problem are scatter plots. Each dot represents a data point.
"Positive correlation" means that when the X value increases, the Y value tends to increase as well (in the long run), while "negative correlation" means that when the X value increases, the Y value tends to decrease. |
|
|
CROSSREFS
|
Adjacent-numbered pages:
BP1266 BP1267 BP1268 BP1269 BP1270 * BP1272 BP1273 BP1274 BP1275 BP1276
|
|
|
EXAMPLE
|
Example TM4854 does not fit on either side because when the X value increases, the Y value stays the same.
Example TM4855 does not fit on either side because there is no correlation. |
|
|
KEYWORD
|
fuzzy, minimal, unwordable, teach, spectrum, dual, handed, leftright, updown, rotate, stable, hardsort, left-narrow, right-narrow
|
|
|
AUTHOR
|
Ben
|
|